

How to create and edit Mermaid Diagrams

Mermaid turns a few lines of text into great looking visuals
I could have used Powerpoint — but even when using SmartArt I find it slow and clunky — and Mermaid can convert text into a variety of sophisticated charts and diagrams.
This isn’t an introduction to Mermaid
Mermaid produces a comprehensive suite of diagrams. I’m not going to introduce you to all that it can do — there’s some links at the end that do — but instead I shall focus on showing you how to produce flowcharts you’d be proud to share.
But first some examples
A simple flowchart
In just 7 lines of text (plus 2 lines of comments, as preceded by the %% symbol) I can create a simple flowchart.
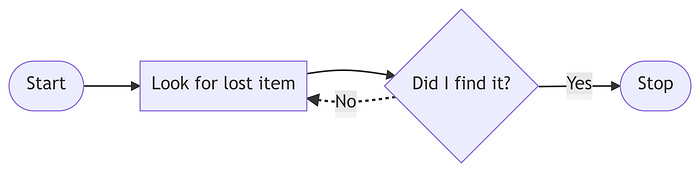
graph LR
%% Nodes
    1([Start])
    2[Look for lost item]
    3{Did I find it?}
    4([Stop])
%% Node links
    1 --> 2 --> 3 -->|Yes| 4
    3 -.->|No| 2
To produce it, I do the following:
Define chart type. To make this flowchart go from Left-to-Right I enter
graph LR. For Top-Down usegraph TD
2. Create the nodes.
Give each node an alias (for simplicity I’ve used the numbers 1 to 4)
After the alias enter the node text between brackets, with the type of brackets determining the shape of the node (eg.
[Node text]creates a rectangular node,((Node text))creates a circular node)
3. Create the links.
To add links with arrows between the node(s) use
-->To change the link style use
-.->for dotted lines,==>for thicker lines, and exclude the>for no end arrowTo add text to links place the text inside pipes after the link
--> |Link text|
A simple Gantt chart
And in just 12 lines of text I can create a gantt chart detailing 6 tasks and 3 activities.
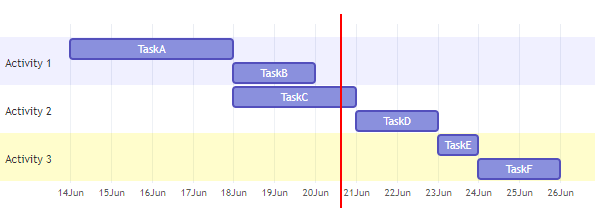
gantt
axisFormat %e%b
todayMarker on
section Activity 1
    TaskA	: TA, 2021-06-14, 4d
    TaskB	: TB, after TA, 2d
section Activity 2
    TaskC	: TC, after TA, 3d
    TaskD	: TD, after TC, 2d
section Activity 3
    TaskE	: TE, after TD, 1d
    TaskF	: TF, after TE, 2d
To produce it:
Define chart type. Enter
ganttin the top lineDefine axis format.
%e%bshows the day of the month and the abbreviated month name. Many axis formats are available, including%Y-%m-%dfor 'YYYY-MM-DD', or if you don't want an axis at all just use%Show time now indicator.
todayMarker onplaces a vertical line showing the current day on the gantt chart. It can also be set tooff[Optional] Define the Activities. This isn’t essential, but I find it useful to quickly see which tasks sit within certain project activities, or belong to certain teams. This is done using the
sectioncommandState the tasks and their parameters. Each task should sit on its own line with:
Visible Text. The text to be visible, such as
TaskAAlias. An alias for the task, separated by the visible text using a colon, such as
: TA,Dependencies. This defines when the task commences, which is typically either on a fixed date
2021-06-14, or dependent on when other activities are completedafter TADuration. How long the task is planned to take. I’ve used days (eg.
4d) but other options include weeks (eg.1w), hours (eg.12h), and minutes (eg.60m)
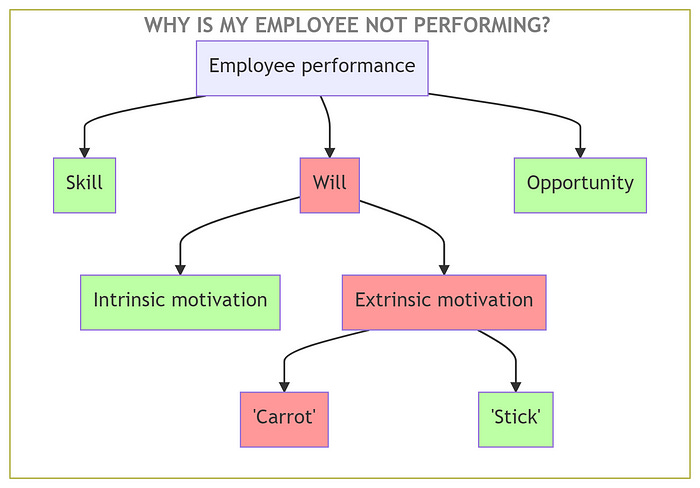
Making smart looking flowcharts
Throughout the rest of this article I’ll be producing a ‘Split-Tree’ — a flowchart like chart — that helps illustrate the root cause of a problem. I’ve written this so you should be able to follow along on your own computer.
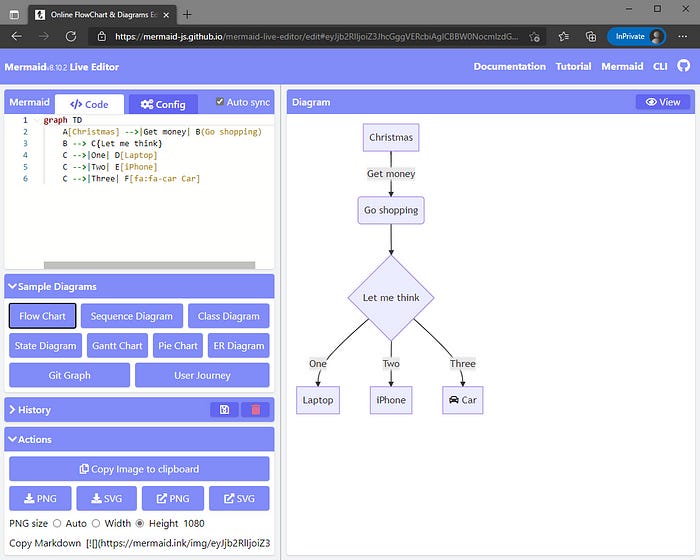
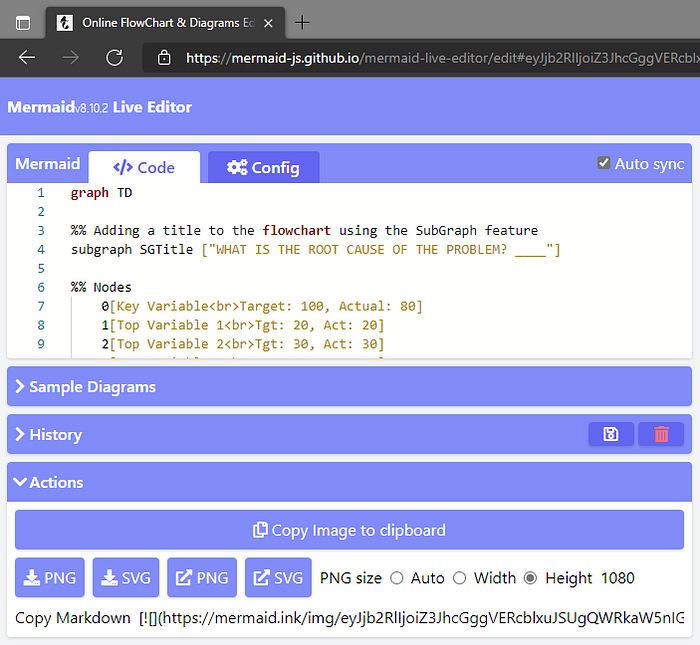
Step-1. Open the Live Editor
Mermaid can be embedded within webpages, it’s pre-built into a number of note taking apps like Joplin, Obsidian, and Typora, and there’s also an online web editor which is probably the easiest way to get started.
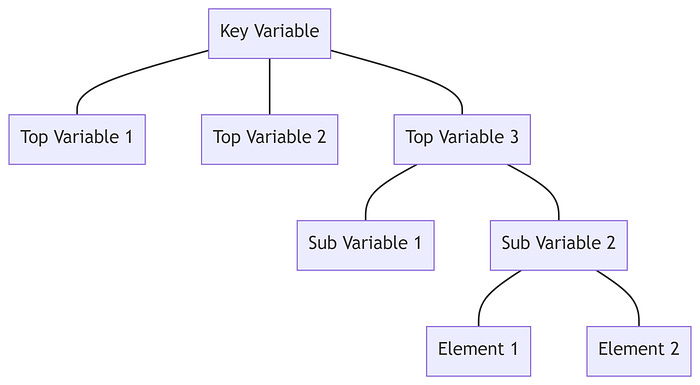
Step-2. Create the basic flowchart layout
First I look to build the basic flowchart:
graph TD
%% Nodes
    0[Key Variable]
    1[Top Variable 1]
    2[Top Variable 2]
    3[Top Variable 3]
    31[Sub Variable 1]
    32[Sub Variable 2]
    321[Element 1]
    322[Element 2]

%% Links
    0 --- 1
    0 --- 2
    0 --- 3
    3 --- 31
    3 --- 32
    32 --- 321
    32 --- 322
I do so by defining each node, and then linking them together. Since this flowchart is in fact a hierarchy diagram, I’ve named my aliases based on how they relate to their ‘parent’ node, hence Sub-Variables 1 and 2 have aliases 31 and 32 since their parent is node 3.
Step-3. Add additional information below node names
Because I’m building a ‘Split-Tree’ to help me solve problems I’m interested in ‘Target’ and ‘Actual’ values for each node.
I can add these in a new line beneath the node text using the <br> HTML element. [For those without coding experience HTML is the programming language that (most) webpages are written in]

%% Nodes
0[Key Variable<br>Target: 100, Actual: 80]
1[Top Variable 1<br>Tgt: 20, Act: 20]
2[Top Variable 2<br>Tgt: 30, Act: 30]
3[Top Variable 3<br>Tgt: 50, Act: 30]
31[Sub Variable 1<br>Tgt: 25, Act: 25]
32[Sub Variable 2<br>Tgt: 25, Act: 5]
321[Element 1<br>Tgt: 20, Act: 1]
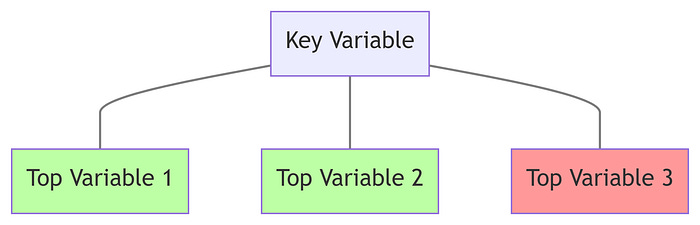
322[Element 2<br>Tgt: 5, Act: 4]Step-4. Apply custom colours
I want to colour the nodes Red, Amber and Green to reflect their status. I can do this by defining certain ‘styles’, and then assigning the styles to each node:

%% Defining the styles
    classDef Red fill:#FF9999;
    classDef Amber fill:#FFDEAD;
    classDef Green fill:#BDFFA4;

%% Assigning styles to nodes
    class 3,32,321 Red;
    class 322 Amber;
    class 1,2,31 Green;
You can set the colour by name (eg. fill:Red; or fill:Black; but for a full spectrum of colours enter the appropriate HEX color code.
I also want to change the colour of the links to make them less prominent, so I amend the default link style:
%% Changing color of links [NOTE: Link arrows will remain black]
    linkStyle default fill: none, stroke: grey;
Step-5. Modify the link curve style
I personally prefer a slightly different style of the links, particularly if I add text to my links. This can be controlled in the ‘Config’ tab in the Mermaid Live Editor.
{
  "theme": "default",
  "flowchart": {
    "curve": "monotoneY"
  }
}
The config tab allows adjustment of other parameters, including:
Theme. Available themes include ‘default’, dark’, ‘neutral’, ‘forest’, ‘base’
Curve. Available line curve options include ‘monotoneY’, ‘basis’, ‘linear’,
Step-6. [Optional] Add a title
Gantt charts can have a title, but unfortunately there’s no title parameter for flowcharts. Since I often embed my charts within a slide which has its own title I rarely find a need for them, but there is a work-round using a ‘subgraph’.
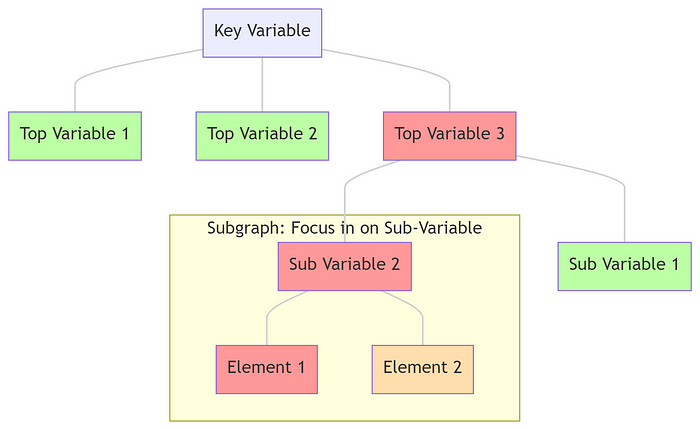
Step-6a. What’s a subgraph?
A subgraph is a great way to break up a larger flowchart, or draw the eyes to focus in on a certain area of the flowchart. And subgraphs do have titles.
%% Nodes
    0[Key Variable]
    1[Top Variable 1]
    2[Top Variable 2]
    3[Top Variable 3]
    31[Sub Variable 1]
    subgraph SG32 ["Subgraph: Focus in on Sub-Variable"]
        32[Sub Variable 2]
        321[Element 1]
        322[Element 2]
    end
Step-6b. Encompassing all nodes within a subgraph
To create a title for the flowchart, however, we need to encompass all nodes within a subgraph:
%% Adding a title to the flowchart using the SubGraph feature
subgraph SGTitle ["WHAT IS THE ROOT CAUSE OF THE PROBLEM?"]

%% Nodes
    0[Key Variable<br>Target: 100, Actual: 80]
    1[Top Variable 1<br>Tgt: 20, Act: 20]
    2[Top Variable 2<br>Tgt: 30, Act: 30]
    3[Top Variable 3<br>Tgt: 50, Act: 30]
    31[Sub Variable 1<br>Tgt: 25, Act: 25]
    32[Sub Variable 2<br>Tgt: 25, Act: 5]
    321[Element 1<br>Tgt: 20, Act: 1]
    322[Element 2<br>Tgt: 5, Act: 4]

%% Close title subgraph
    end
We then hide the subgraph using custom styling:
%% Styling the title subgraph
    classDef Title fill:#FF99FF00, stroke-width:0, color:grey;
    class SGTitle Title;
Background colour. The
fillparameter controls the background colour. I want it transparent, since digits 7 and 8 of a hex code control the opacity I assign them as00Border colour. The
stroke-widthandstrokeparameters control the border width and colour. I do not want a border, hence I assign the width as0.Title font colour. I set the
colorparameter togrey.
Step-6c. Ensuring all the title is visible
If you want to make the title bold and/or change the font size then there is a slight bug that could cut off the end of the title.
By adding extra characters at the end, however, this can be overcome.
The title now reads:
%% Adding a title to the flowchart using the SubGraph feature
subgraph SGTitle ["WHAT IS THE ROOT CAUSE OF THE PROBLEM? ____"]
And the styling is now set as:
%% Styling the title subgraph
    classDef Title fill:#FF99FF00, stroke-width:0, color:grey, font-weight:bold, font-size: 17px;
    class SGTitle Title;
Step-7. Export as PNG/SVG
To export the mermaid chart open the ‘Action’ panel in the Live Editor and choose whichever option best suits you need:
The finished article
The completed flowchart now looks like:

And the full code is:
graph TD%% Adding a title to the flowchart using the SubGraph feature
subgraph SGTitle ["WHAT IS THE ROOT CAUSE OF THE PROBLEM? ____"]%% Nodes
    0[Key Variable<br>Target: 100, Actual: 80]
    1[Top Variable 1<br>Tgt: 20, Act: 20]
    2[Top Variable 2<br>Tgt: 30, Act: 30]
    3[Top Variable 3<br>Tgt: 50, Act: 30]
    31[Sub Variable 1<br>Tgt: 25, Act: 25]
    32[Sub Variable 2<br>Tgt: 25, Act: 5]
    321[Element 1<br>Tgt: 20, Act: 1]
    322[Element 2<br>Tgt: 5, Act: 4]%% Close title subgraph
    end%% Links
    0 --- 1
    0 --- 2
    0 --- 3
    3 --- 31
    3 --- 32
    32 --- 321
    32 --- 322%% Defining node styles
    classDef Red fill:#FF9999;
    classDef Amber	fill:#FFDEAD;
    classDef Green fill:#BDFFA4;%% Assigning styles to nodes
    class 3,32,321 Red;
    class 322 Amber;
    class 1,2,31 Green;

%% Changing color of links [NOTE: Link arrows will remain black]
    linkStyle default fill: none, stroke: grey;

%% Styling the title subgraph
    classDef Title fill:#FF99FF00, stroke-width:0, color:grey, font-weight:bold, font-size: 17px;
    class SGTitle Title;
Learn more about Mermaid
Hopefully you’ve seen how easy it is to produce some great looking charts rapidly using Mermaid.
If you wish to learn more about Mermaid there’s a wealth of information available online, including via the following Medium articles:
Please just shout if you have any questions or wish to know more!